Review


griffonia simplicifolia i  (Vector Laboratories)


Bioz Verified Symbol Vector Laboratories is a verified supplier

Bioz Manufacturer Symbol Vector Laboratories manufactures this product  

  • Logo
  • About
  • News
  • Press Release
  • Team
  • Advisors
  • Partners
  • Contact
  • Bioz Stars
  • Bioz vStars
  • 92

    Structured Review

    Vector Laboratories griffonia simplicifolia i
    Griffonia Simplicifolia I, supplied by Vector Laboratories, used in various techniques. Bioz Stars score: 92/100, based on 135 PubMed citations. ZERO BIAS - scores, article reviews, protocol conditions and more
    https://www.bioz.com/product/L-1210-5/Unconjugated+Griffonia+(Bandeiraea)+Simplicifolia+Lectin+II+(GSL+II%2C+BSL+II)/bio_rxiv__2025__01__18__633447-396-37-44
    Average 92 stars, based on 135 article reviews
    griffonia simplicifolia i - by Bioz Stars, 2026-11
    92/100 stars

    Images

    Related Articles

    Pull Down Assay:

    Article Title: Decreased B4GALT1 promotes hepatocellular carcinoma cell invasiveness by regulating the laminin-integrin pathway.
    Article Snippet: .. For the lectin pull-down assay, cell lysates (1 mg) were incubated with Griffonia Simplicifolia Lectin II (GSL-II) biotinylated (Vector Laboratories) at 4 °C for 16 h. The next day, the sample was incubated with streptavidin beads (Vector Laboratories) for 2 h at room temperature. ..

    Article Title: Decreased B4GALT1 promotes hepatocellular carcinoma cell invasiveness by regulating the laminin-integrin pathway
    Article Snippet: .. For the lectin pull-down assay, cell lysates (1 mg) were incubated with Griffonia Simplicifolia Lectin II (GSL-II) biotinylated (Vector Laboratories) at 4 °C for 16 h. The next day, the sample was incubated with streptavidin beads (Vector Laboratories) for 2 h at room temperature. ..

    Incubation:

    Article Title: Decreased B4GALT1 promotes hepatocellular carcinoma cell invasiveness by regulating the laminin-integrin pathway.
    Article Snippet: .. For the lectin pull-down assay, cell lysates (1 mg) were incubated with Griffonia Simplicifolia Lectin II (GSL-II) biotinylated (Vector Laboratories) at 4 °C for 16 h. The next day, the sample was incubated with streptavidin beads (Vector Laboratories) for 2 h at room temperature. ..

    Article Title: Persistent interferon signaling that causes sensory neuron plasticity and pain in arthritis
    Article Snippet: For staining, mounted sections were dried at room temperature for at least 30 min and then incubated with antibodies against NF200 (1:1 000, chicken, Abcam), CGRP (1:10 000, rabbit, gift from Tomas Hökfelt), GFP (1:1 000, chicken, Abcam) and TH (1:200, rabbit, Pel-Freez) diluted in phos-phate-buffered saline (PBS) containing 0.2% (wt/vol) BSA (Sigma) and 0.3% Triton X-100 (Sigma) in a humid chamber at 4 °C for 48h. .. Immunoreactivities was visualized with secondary IgG (H+L) antibody conjugated with Alexa FluorTM dyes (Invitrogen) at room temperature for 90 min. For IB4 staining, slides were rinsed in PBS for 20 min and incubated with IB4 (1:400) from Griffonia simplicifolia I (GSA I) (2.5 g/mL; Vector Laboratories), followed by overnight incubation with a goat anti-GSA I antiserum (1:2 000; Vector Laboratories). .. Finally, the sections were incubated with IgG (H +L) secondary antibody conjugated with Alexa Fluor (Invitrogen) to visualize the IB4 binding.

    Article Title: Decreased B4GALT1 promotes hepatocellular carcinoma cell invasiveness by regulating the laminin-integrin pathway
    Article Snippet: .. For the lectin pull-down assay, cell lysates (1 mg) were incubated with Griffonia Simplicifolia Lectin II (GSL-II) biotinylated (Vector Laboratories) at 4 °C for 16 h. The next day, the sample was incubated with streptavidin beads (Vector Laboratories) for 2 h at room temperature. ..

    Article Title: Apoptotic Vesicles Modulate Endothelial Metabolism and Ameliorate Ischemic Retinopathy via PD1/PDL1 Axis.
    Article Snippet: .. Samples were incubated with fluorescein-labeled Griffonia Simplicifolia Lectin I (GSL I) isolectin B4 (1:100, FL-1201, Vector Labs) in PBS overnight at 4 °C. ..

    Membrane:

    Article Title: Maternal high-fat, high-sucrose diet-induced excess adiposity is linked to placental hypoxia and disruption of fetoplacental immune homeostasis in late gestation
    Article Snippet: .. Placentas were fluorescently co-stained for labyrinth pericytes using a monoclonal anti-alpha smooth muscle actin antibody (α-SMA; clone 1A4, Abcam), and the vascular basement membrane using Isolectin β4 from Griffonia Simplicifolia (GS-Iβ4, Vector Laboratories) to identify fetal vascular structures within the placenta ( , ). ..

    Staining:

    Article Title: Persistent interferon signaling that causes sensory neuron plasticity and pain in arthritis
    Article Snippet: For staining, mounted sections were dried at room temperature for at least 30 min and then incubated with antibodies against NF200 (1:1 000, chicken, Abcam), CGRP (1:10 000, rabbit, gift from Tomas Hökfelt), GFP (1:1 000, chicken, Abcam) and TH (1:200, rabbit, Pel-Freez) diluted in phos-phate-buffered saline (PBS) containing 0.2% (wt/vol) BSA (Sigma) and 0.3% Triton X-100 (Sigma) in a humid chamber at 4 °C for 48h. .. Immunoreactivities was visualized with secondary IgG (H+L) antibody conjugated with Alexa FluorTM dyes (Invitrogen) at room temperature for 90 min. For IB4 staining, slides were rinsed in PBS for 20 min and incubated with IB4 (1:400) from Griffonia simplicifolia I (GSA I) (2.5 g/mL; Vector Laboratories), followed by overnight incubation with a goat anti-GSA I antiserum (1:2 000; Vector Laboratories). .. Finally, the sections were incubated with IgG (H +L) secondary antibody conjugated with Alexa Fluor (Invitrogen) to visualize the IB4 binding.

    other:

    Article Title: Molecular differences between neonatal and adult stria vascularis from organotypic explants and transcriptomics
    Article Snippet: The following primary antibodies were used: Purified mouse anti-BrdU (1:250; BD Biosciences 555627), rabbit anti Ki67 (1:500, Abcam ab15580), rabbit anti Cldn11 (1:250; Santa Cruz sc-25711), rabbit anti Kir4.1 (1:250; Alomone Labs APC-035), and guinea pig anti Kcnq1 (1:250; Alomone Labs APC-022-GP).


    Similar Products

    92
    Vector Laboratories griffonia simplicifolia i
    Griffonia Simplicifolia I, supplied by Vector Laboratories, used in various techniques. Bioz Stars score: 92/100, based on 1 PubMed citations. ZERO BIAS - scores, article reviews, protocol conditions and more
    https://www.bioz.com/product/L-1210-5/Unconjugated+Griffonia+(Bandeiraea)+Simplicifolia+Lectin+II+(GSL+II%2C+BSL+II)/bio_rxiv__2025__01__18__633447-396-37-44
    Average 92 stars, based on 1 article reviews
    griffonia simplicifolia i - by Bioz Stars, 2026-11
    92/100 stars
      Buy from Supplier

    92
    Vector Laboratories griffonia simplicifolia
    (a) Representative composite images of H&E-stained placentas. Boundaries between Labyrinth (Lab), Junctional Zone (JZ), and maternal tissue (decidual basalis (DB) and myometrium (Myo)) were defined based on tissue architecture (hashed lines); scale bar = 1000 µm. (b) Cross sectional areas of the total placenta (combined JZ and Lab), individual compartments, (c) area ratios, and proportional areas were measured for placentas from CON and HFHS pregnancies. (d) Representative multi-channel overlay of fields from the Labyrinth of CON and HFHS placentas co-stained for the vascular basement membrane and perivascular cells (pericytes) using isolectin beta 4 from <t>Griffonia</t> <t>Simplicifolia</t> <t>(GS-Iβ4,</t> magenta), anti-alpha smooth muscle actin monoclonal antibody (α-SMA, green), respectively; scale bar = 100 µm. (e) Proportional area within the Labyrinth occupied by fetoplacental vasculature, defined using combined staining of GS-Iβ4 and α-SMA (Fetal Vascular Area). (f) Stability of fetoplacental vasculature measured according to the percent of the Fetal Vascular Area occupied by α-SMA positive staining Data are presented with boxplots depicting the min and max values within 1.5 IQR (whiskers), IQR (box), and median (center line). Large data points represent the mean of replicate measures from sample replicates, small data points depict individual values of each sample replicate. Data were analysed using two-way ANOVA on mixed effects linear models with diet and sex as fixed effects and sample (placenta) as a random effect. P-values are indicated where main effects were statistically significant. Boxplots without shared letters are significantly different from one another according to post-hoc comparison of estimated marginal means. All samples were analysed in triplicate for CON (n = 5 – 6/sex) and HFHS (n = 8/sex) placentas. All samples are taken from composite images imaged at 20× magnification.
    Griffonia Simplicifolia, supplied by Vector Laboratories, used in various techniques. Bioz Stars score: 92/100, based on 1 PubMed citations. ZERO BIAS - scores, article reviews, protocol conditions and more
    https://www.bioz.com/product/L-1210-5/Unconjugated+Griffonia+(Bandeiraea)+Simplicifolia+Lectin+II+(GSL+II%2C+BSL+II)/bio_rxiv__2024__09__30__615691-105-28-31
    Average 92 stars, based on 1 article reviews
    griffonia simplicifolia - by Bioz Stars, 2026-11
    92/100 stars
      Buy from Supplier

    92
    Vector Laboratories griffonia bandeiraea simplicifolia lectin
    P30 cross section of a cochlear turn (A) and P0 wholemount stria vascularis (B) stained with Phalloidin for actin (green) <t>Lectin</t> for blood vessels (magenta) and DAPI for nuclei (blue). Orthogonal view of the wholemount SV in bottom panel of (B) marks the nuclei of the three cell layers of the SV (white dashed lines; m= marginal cells, i = intermediate cells, b = basal cells). Scale bars in A: 50 µm in low magnification images, 10 µm in high magnification images. Scale bars in B: 50 µm. C) Side-by-side differential interference contrast imaging of neonatal and adult SV organotypic explants. SV were dissected and cultured on Matrigel-coated plates in standard conditions for 72 h. Scale bar: 1 mm.
    Griffonia Bandeiraea Simplicifolia Lectin, supplied by Vector Laboratories, used in various techniques. Bioz Stars score: 92/100, based on 1 PubMed citations. ZERO BIAS - scores, article reviews, protocol conditions and more
    https://www.bioz.com/product/L-1210-5/Unconjugated+Griffonia+(Bandeiraea)+Simplicifolia+Lectin+II+(GSL+II%2C+BSL+II)/bio_rxiv__2024__04__24__590986-63-0-11
    Average 92 stars, based on 1 article reviews
    griffonia bandeiraea simplicifolia lectin - by Bioz Stars, 2026-11
    92/100 stars
      Buy from Supplier

    92
    Vector Laboratories griffonia simplicifolia lectin gsl
    P30 cross section of a cochlear turn (A) and P0 wholemount stria vascularis (B) stained with Phalloidin for actin (green) <t>Lectin</t> for blood vessels (magenta) and DAPI for nuclei (blue). Orthogonal view of the wholemount SV in bottom panel of (B) marks the nuclei of the three cell layers of the SV (white dashed lines; m= marginal cells, i = intermediate cells, b = basal cells). Scale bars in A: 50 µm in low magnification images, 10 µm in high magnification images. Scale bars in B: 50 µm. C) Side-by-side differential interference contrast imaging of neonatal and adult SV organotypic explants. SV were dissected and cultured on Matrigel-coated plates in standard conditions for 72 h. Scale bar: 1 mm.
    Griffonia Simplicifolia Lectin Gsl, supplied by Vector Laboratories, used in various techniques. Bioz Stars score: 92/100, based on 1 PubMed citations. ZERO BIAS - scores, article reviews, protocol conditions and more
    https://www.bioz.com/product/L-1210-5/Unconjugated+Griffonia+(Bandeiraea)+Simplicifolia+Lectin+II+(GSL+II%2C+BSL+II)/pmc11148122-83-0-10
    Average 92 stars, based on 1 article reviews
    griffonia simplicifolia lectin gsl - by Bioz Stars, 2026-11
    92/100 stars
      Buy from Supplier

    92
    Vector Laboratories griffonia simplicifolia lectin
    P30 cross section of a cochlear turn (A) and P0 wholemount stria vascularis (B) stained with Phalloidin for actin (green) <t>Lectin</t> for blood vessels (magenta) and DAPI for nuclei (blue). Orthogonal view of the wholemount SV in bottom panel of (B) marks the nuclei of the three cell layers of the SV (white dashed lines; m= marginal cells, i = intermediate cells, b = basal cells). Scale bars in A: 50 µm in low magnification images, 10 µm in high magnification images. Scale bars in B: 50 µm. C) Side-by-side differential interference contrast imaging of neonatal and adult SV organotypic explants. SV were dissected and cultured on Matrigel-coated plates in standard conditions for 72 h. Scale bar: 1 mm.
    Griffonia Simplicifolia Lectin, supplied by Vector Laboratories, used in various techniques. Bioz Stars score: 92/100, based on 1 PubMed citations. ZERO BIAS - scores, article reviews, protocol conditions and more
    https://www.bioz.com/product/L-1210-5/Unconjugated+Griffonia+(Bandeiraea)+Simplicifolia+Lectin+II+(GSL+II%2C+BSL+II)/pm38411334-286-5-15
    Average 92 stars, based on 1 article reviews
    griffonia simplicifolia lectin - by Bioz Stars, 2026-11
    92/100 stars
      Buy from Supplier

    92
    Vector Laboratories griffonia simplicifolia lectin ii gsl ii
    A <t>GSL-II</t> <t>lectin</t> pull-down assay for integrin β1. Proteins in cell lysates from B4GALT1 knockdown PLC5 and HA22T cells and B4GALT1 knockout PLC5 cells were pulled down using GSL-II agarose beads and immunoblotted using an anti-integrin β1 (ITGB1). Three independent siRNAs for B4GALT1and two independent B4GALT1 knockout clones were used, as indicated. B GSL-II lectin pull-down assay for integrin α6. Proteins in the cell lysates from B4GALT1 knockdown PLC5 and HA22T cells and B4GALT1 knockout PLC5 cells were pulled down using GSL-II agarose beads and immunoblotted using an anti-integrin α6 (ITGA6). C B4GALT1 predominantly modified N-glycans on integrin β1. PLC5 cell lysates (0.5 mg) were treated with PNGase F and then pulled down (PD) using GSL-II lectin. The pull-down proteins were separated using 6% SDS-PAGE and analyzed via immunoblotting with anti-ITGB1. D B4GALT1 predominantly modified N-glycans on integrin α6. PLC5 cell lysates (0.5 mg) were treated with PNGase F and then pulled down (PD) using GSL-II lectin. The pulled-down proteins were separated using 6% SDS-PAGE and analyzed via immunoblotting using anti-ITGA6 (A) or anti-ITGA6 (B) antibody. Representative results from three independent experiments are shown. Data are presented as the mean ± SD. * P < 0.05; ** P < 0.01; *** P < 0.001, Student’s t -test.
    Griffonia Simplicifolia Lectin Ii Gsl Ii, supplied by Vector Laboratories, used in various techniques. Bioz Stars score: 92/100, based on 1 PubMed citations. ZERO BIAS - scores, article reviews, protocol conditions and more
    https://www.bioz.com/product/L-1210-5/Unconjugated+Griffonia+(Bandeiraea)+Simplicifolia+Lectin+II+(GSL+II%2C+BSL+II)/pmc10618527-331-12-18
    Average 92 stars, based on 1 article reviews
    griffonia simplicifolia lectin ii gsl ii - by Bioz Stars, 2026-11
    92/100 stars
      Buy from Supplier

    92
    Vector Laboratories griffonia simplicifolia ii gsii lectin
    A <t>GSL-II</t> <t>lectin</t> pull-down assay for integrin β1. Proteins in cell lysates from B4GALT1 knockdown PLC5 and HA22T cells and B4GALT1 knockout PLC5 cells were pulled down using GSL-II agarose beads and immunoblotted using an anti-integrin β1 (ITGB1). Three independent siRNAs for B4GALT1and two independent B4GALT1 knockout clones were used, as indicated. B GSL-II lectin pull-down assay for integrin α6. Proteins in the cell lysates from B4GALT1 knockdown PLC5 and HA22T cells and B4GALT1 knockout PLC5 cells were pulled down using GSL-II agarose beads and immunoblotted using an anti-integrin α6 (ITGA6). C B4GALT1 predominantly modified N-glycans on integrin β1. PLC5 cell lysates (0.5 mg) were treated with PNGase F and then pulled down (PD) using GSL-II lectin. The pull-down proteins were separated using 6% SDS-PAGE and analyzed via immunoblotting with anti-ITGB1. D B4GALT1 predominantly modified N-glycans on integrin α6. PLC5 cell lysates (0.5 mg) were treated with PNGase F and then pulled down (PD) using GSL-II lectin. The pulled-down proteins were separated using 6% SDS-PAGE and analyzed via immunoblotting using anti-ITGA6 (A) or anti-ITGA6 (B) antibody. Representative results from three independent experiments are shown. Data are presented as the mean ± SD. * P < 0.05; ** P < 0.01; *** P < 0.001, Student’s t -test.
    Griffonia Simplicifolia Ii Gsii Lectin, supplied by Vector Laboratories, used in various techniques. Bioz Stars score: 92/100, based on 1 PubMed citations. ZERO BIAS - scores, article reviews, protocol conditions and more
    https://www.bioz.com/product/L-1210-5/Unconjugated+Griffonia+(Bandeiraea)+Simplicifolia+Lectin+II+(GSL+II%2C+BSL+II)/pm37823252-44-0-8
    Average 92 stars, based on 1 article reviews
    griffonia simplicifolia ii gsii lectin - by Bioz Stars, 2026-11
    92/100 stars
      Buy from Supplier

    92
    Vector Laboratories biotinylatedgriffonia simplicifolia lectin i
    A <t>GSL-II</t> <t>lectin</t> pull-down assay for integrin β1. Proteins in cell lysates from B4GALT1 knockdown PLC5 and HA22T cells and B4GALT1 knockout PLC5 cells were pulled down using GSL-II agarose beads and immunoblotted using an anti-integrin β1 (ITGB1). Three independent siRNAs for B4GALT1and two independent B4GALT1 knockout clones were used, as indicated. B GSL-II lectin pull-down assay for integrin α6. Proteins in the cell lysates from B4GALT1 knockdown PLC5 and HA22T cells and B4GALT1 knockout PLC5 cells were pulled down using GSL-II agarose beads and immunoblotted using an anti-integrin α6 (ITGA6). C B4GALT1 predominantly modified N-glycans on integrin β1. PLC5 cell lysates (0.5 mg) were treated with PNGase F and then pulled down (PD) using GSL-II lectin. The pull-down proteins were separated using 6% SDS-PAGE and analyzed via immunoblotting with anti-ITGB1. D B4GALT1 predominantly modified N-glycans on integrin α6. PLC5 cell lysates (0.5 mg) were treated with PNGase F and then pulled down (PD) using GSL-II lectin. The pulled-down proteins were separated using 6% SDS-PAGE and analyzed via immunoblotting using anti-ITGA6 (A) or anti-ITGA6 (B) antibody. Representative results from three independent experiments are shown. Data are presented as the mean ± SD. * P < 0.05; ** P < 0.01; *** P < 0.001, Student’s t -test.
    Biotinylatedgriffonia Simplicifolia Lectin I, supplied by Vector Laboratories, used in various techniques. Bioz Stars score: 92/100, based on 1 PubMed citations. ZERO BIAS - scores, article reviews, protocol conditions and more
    https://www.bioz.com/product/L-1210-5/Unconjugated+Griffonia+(Bandeiraea)+Simplicifolia+Lectin+II+(GSL+II%2C+BSL+II)/pm36007889-74-38-46
    Average 92 stars, based on 1 article reviews
    biotinylatedgriffonia simplicifolia lectin i - by Bioz Stars, 2026-11
    92/100 stars
      Buy from Supplier

    Image Search Results


    (a) Representative composite images of H&E-stained placentas. Boundaries between Labyrinth (Lab), Junctional Zone (JZ), and maternal tissue (decidual basalis (DB) and myometrium (Myo)) were defined based on tissue architecture (hashed lines); scale bar = 1000 µm. (b) Cross sectional areas of the total placenta (combined JZ and Lab), individual compartments, (c) area ratios, and proportional areas were measured for placentas from CON and HFHS pregnancies. (d) Representative multi-channel overlay of fields from the Labyrinth of CON and HFHS placentas co-stained for the vascular basement membrane and perivascular cells (pericytes) using isolectin beta 4 from Griffonia Simplicifolia (GS-Iβ4, magenta), anti-alpha smooth muscle actin monoclonal antibody (α-SMA, green), respectively; scale bar = 100 µm. (e) Proportional area within the Labyrinth occupied by fetoplacental vasculature, defined using combined staining of GS-Iβ4 and α-SMA (Fetal Vascular Area). (f) Stability of fetoplacental vasculature measured according to the percent of the Fetal Vascular Area occupied by α-SMA positive staining Data are presented with boxplots depicting the min and max values within 1.5 IQR (whiskers), IQR (box), and median (center line). Large data points represent the mean of replicate measures from sample replicates, small data points depict individual values of each sample replicate. Data were analysed using two-way ANOVA on mixed effects linear models with diet and sex as fixed effects and sample (placenta) as a random effect. P-values are indicated where main effects were statistically significant. Boxplots without shared letters are significantly different from one another according to post-hoc comparison of estimated marginal means. All samples were analysed in triplicate for CON (n = 5 – 6/sex) and HFHS (n = 8/sex) placentas. All samples are taken from composite images imaged at 20× magnification.

    Journal: bioRxiv

    Article Title: Maternal high-fat, high-sucrose diet-induced excess adiposity is linked to placental hypoxia and disruption of fetoplacental immune homeostasis in late gestation

    doi: 10.1101/2024.09.30.615691

    Figure Lengend Snippet: (a) Representative composite images of H&E-stained placentas. Boundaries between Labyrinth (Lab), Junctional Zone (JZ), and maternal tissue (decidual basalis (DB) and myometrium (Myo)) were defined based on tissue architecture (hashed lines); scale bar = 1000 µm. (b) Cross sectional areas of the total placenta (combined JZ and Lab), individual compartments, (c) area ratios, and proportional areas were measured for placentas from CON and HFHS pregnancies. (d) Representative multi-channel overlay of fields from the Labyrinth of CON and HFHS placentas co-stained for the vascular basement membrane and perivascular cells (pericytes) using isolectin beta 4 from Griffonia Simplicifolia (GS-Iβ4, magenta), anti-alpha smooth muscle actin monoclonal antibody (α-SMA, green), respectively; scale bar = 100 µm. (e) Proportional area within the Labyrinth occupied by fetoplacental vasculature, defined using combined staining of GS-Iβ4 and α-SMA (Fetal Vascular Area). (f) Stability of fetoplacental vasculature measured according to the percent of the Fetal Vascular Area occupied by α-SMA positive staining Data are presented with boxplots depicting the min and max values within 1.5 IQR (whiskers), IQR (box), and median (center line). Large data points represent the mean of replicate measures from sample replicates, small data points depict individual values of each sample replicate. Data were analysed using two-way ANOVA on mixed effects linear models with diet and sex as fixed effects and sample (placenta) as a random effect. P-values are indicated where main effects were statistically significant. Boxplots without shared letters are significantly different from one another according to post-hoc comparison of estimated marginal means. All samples were analysed in triplicate for CON (n = 5 – 6/sex) and HFHS (n = 8/sex) placentas. All samples are taken from composite images imaged at 20× magnification.

    Article Snippet: Placentas were fluorescently co-stained for labyrinth pericytes using a monoclonal anti-alpha smooth muscle actin antibody (α-SMA; clone 1A4, Abcam), and the vascular basement membrane using Isolectin β4 from Griffonia Simplicifolia (GS-Iβ4, Vector Laboratories) to identify fetal vascular structures within the placenta ( , ).

    Techniques: Staining, Membrane, Comparison

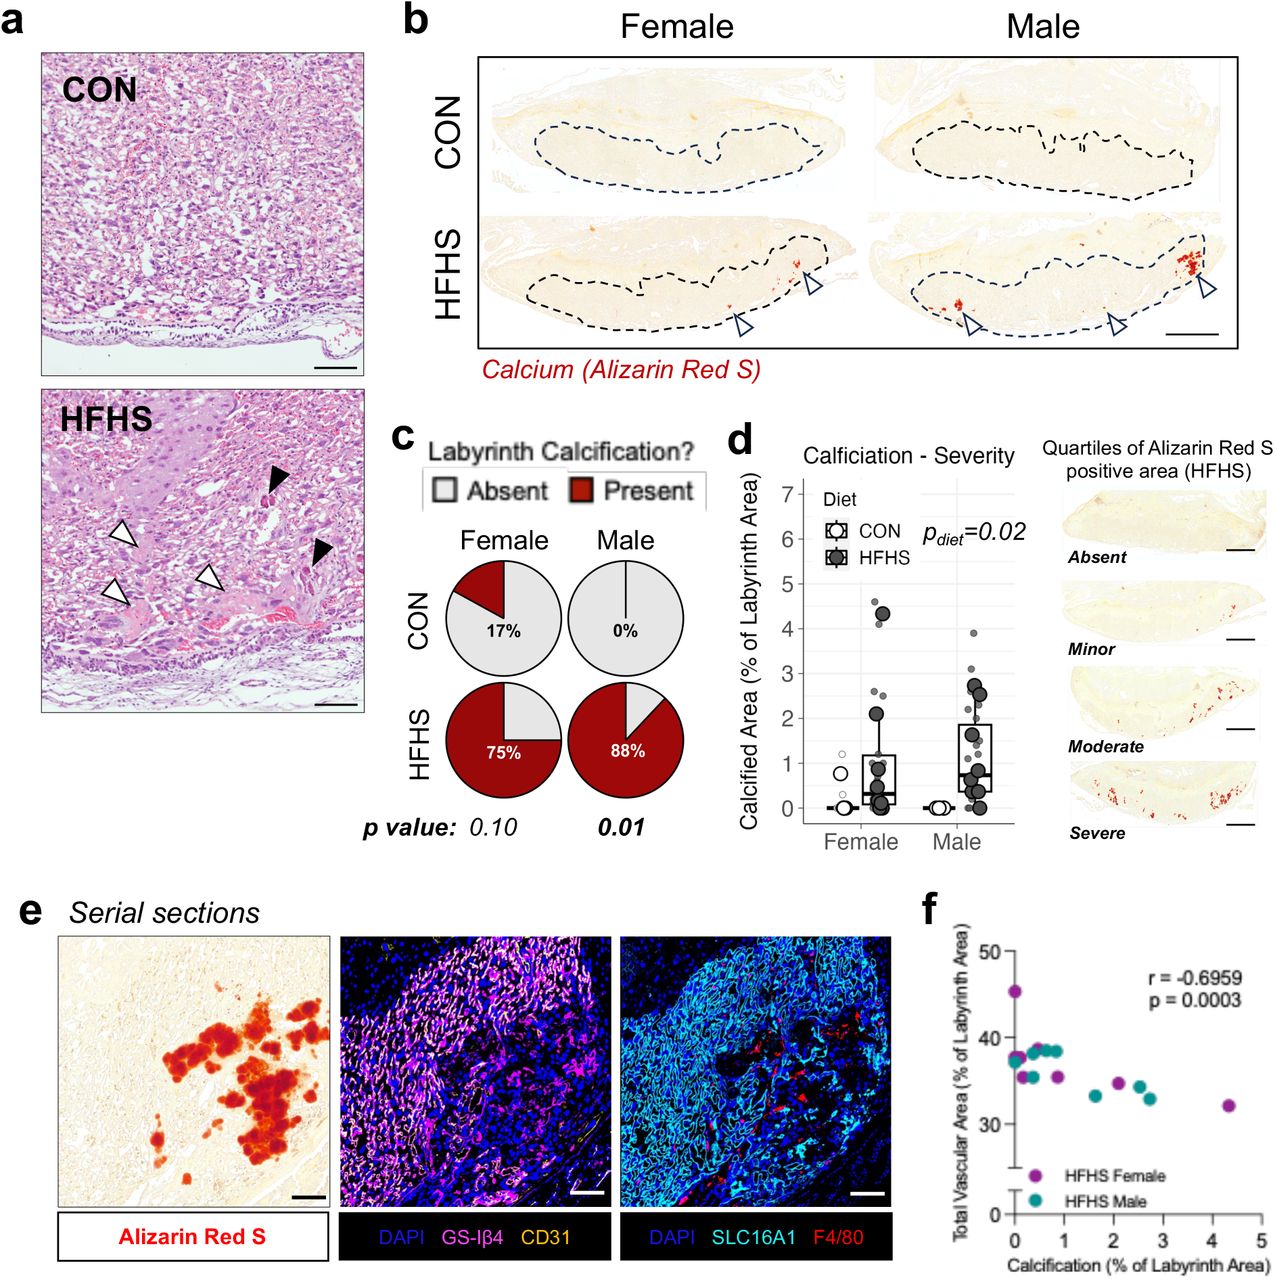
    (a) H&E staining of CON and HFHS placental tissues depicting representative histopathology of CON and HFHS placentas. The presence of tissue lesions consistent with occlusions/calcification (black arrows) and eosinophilic fibrinoid deposition (white arrows) were more frequently observed in HFHS samples; scale bar = 100 µm. (b) Representative composite images of tissue sections from CON (n = 5 – 6/sex) and HFHS (n = 8/sex) stained for calcium deposition using Alizarin Red S. Hashed outlines indicate the labyrinth zone, to which analysis was restricted. White arrows indicate calcified foci; scale bar = 1000 µm. (c) Percent of placental samples with the presence of calcium in at least one replicate tissue section (3 replicates/sample). (d) Quantification of calcification severity based on the percent Alizarin Red S positive area; images depict representative samples each quartile of Alizarin Red S staining within the HFHS group (both males and females); scale bar = 1000 µm. (e) Representative fields of the labyrinth from serial placental sections stained for calcium (left panel), placental vascular endothelium (GS-Iβ4, CD31; middle panel), or syncytiotrophoblast and macrophages (SLC16A1 and F4/80, respectively; right panel); scale bar = 100 µm. (f) Correlation of mean placental labyrinth calcification and fetoplacental vascular proportional areas in HFHS female (magenta) and male (teal) samples. Data in (c) are presented with boxplots depicting the IQR (box), median (center line) and min and max values within 1.5 IQR for mean values (whiskers); large data points represent the mean value of triplicate measures per sample, small data points represent individual replicates. Data points in (f) represent the mean value for each sample. All representative image fields were taken from composite stitched images of whole tissue sections imaged at 20× magnification. Data were analysed using Fisher’s exact test with post-hoc Bonferroni correction for multiple testing (b), two-way ANOVA on mixed effects linear models (c) or Spearman correlation (f).

    Journal: bioRxiv

    Article Title: Maternal high-fat, high-sucrose diet-induced excess adiposity is linked to placental hypoxia and disruption of fetoplacental immune homeostasis in late gestation

    doi: 10.1101/2024.09.30.615691

    Figure Lengend Snippet: (a) H&E staining of CON and HFHS placental tissues depicting representative histopathology of CON and HFHS placentas. The presence of tissue lesions consistent with occlusions/calcification (black arrows) and eosinophilic fibrinoid deposition (white arrows) were more frequently observed in HFHS samples; scale bar = 100 µm. (b) Representative composite images of tissue sections from CON (n = 5 – 6/sex) and HFHS (n = 8/sex) stained for calcium deposition using Alizarin Red S. Hashed outlines indicate the labyrinth zone, to which analysis was restricted. White arrows indicate calcified foci; scale bar = 1000 µm. (c) Percent of placental samples with the presence of calcium in at least one replicate tissue section (3 replicates/sample). (d) Quantification of calcification severity based on the percent Alizarin Red S positive area; images depict representative samples each quartile of Alizarin Red S staining within the HFHS group (both males and females); scale bar = 1000 µm. (e) Representative fields of the labyrinth from serial placental sections stained for calcium (left panel), placental vascular endothelium (GS-Iβ4, CD31; middle panel), or syncytiotrophoblast and macrophages (SLC16A1 and F4/80, respectively; right panel); scale bar = 100 µm. (f) Correlation of mean placental labyrinth calcification and fetoplacental vascular proportional areas in HFHS female (magenta) and male (teal) samples. Data in (c) are presented with boxplots depicting the IQR (box), median (center line) and min and max values within 1.5 IQR for mean values (whiskers); large data points represent the mean value of triplicate measures per sample, small data points represent individual replicates. Data points in (f) represent the mean value for each sample. All representative image fields were taken from composite stitched images of whole tissue sections imaged at 20× magnification. Data were analysed using Fisher’s exact test with post-hoc Bonferroni correction for multiple testing (b), two-way ANOVA on mixed effects linear models (c) or Spearman correlation (f).

    Article Snippet: Placentas were fluorescently co-stained for labyrinth pericytes using a monoclonal anti-alpha smooth muscle actin antibody (α-SMA; clone 1A4, Abcam), and the vascular basement membrane using Isolectin β4 from Griffonia Simplicifolia (GS-Iβ4, Vector Laboratories) to identify fetal vascular structures within the placenta ( , ).

    Techniques: Staining, Histopathology

    P30 cross section of a cochlear turn (A) and P0 wholemount stria vascularis (B) stained with Phalloidin for actin (green) Lectin for blood vessels (magenta) and DAPI for nuclei (blue). Orthogonal view of the wholemount SV in bottom panel of (B) marks the nuclei of the three cell layers of the SV (white dashed lines; m= marginal cells, i = intermediate cells, b = basal cells). Scale bars in A: 50 µm in low magnification images, 10 µm in high magnification images. Scale bars in B: 50 µm. C) Side-by-side differential interference contrast imaging of neonatal and adult SV organotypic explants. SV were dissected and cultured on Matrigel-coated plates in standard conditions for 72 h. Scale bar: 1 mm.

    Journal: bioRxiv

    Article Title: Molecular differences between neonatal and adult stria vascularis from organotypic explants and transcriptomics

    doi: 10.1101/2024.04.24.590986

    Figure Lengend Snippet: P30 cross section of a cochlear turn (A) and P0 wholemount stria vascularis (B) stained with Phalloidin for actin (green) Lectin for blood vessels (magenta) and DAPI for nuclei (blue). Orthogonal view of the wholemount SV in bottom panel of (B) marks the nuclei of the three cell layers of the SV (white dashed lines; m= marginal cells, i = intermediate cells, b = basal cells). Scale bars in A: 50 µm in low magnification images, 10 µm in high magnification images. Scale bars in B: 50 µm. C) Side-by-side differential interference contrast imaging of neonatal and adult SV organotypic explants. SV were dissected and cultured on Matrigel-coated plates in standard conditions for 72 h. Scale bar: 1 mm.

    Article Snippet: Griffonia (Bandeiraea) Simplicifolia Lectin I (GSL I, BSL I), Fluorescein (1:250; Vector Laboratories FL-1101-2), or Rhodamine (Vector Laboratories RL-1102-2) was used to stain blood vessels.

    Techniques: Staining, Imaging, Cell Culture

    (A-C) Representative images of organotypic stria vascularis explants at P0, P7 and P30 cultured with the proliferation marker, BrdU (red), over 72 h. (A’-C’) Merged images of BrdU + nuclei and DAPI stained nuclei (blue). Scale bars: 1 mm in A-B’; 200 µm in C-C’. (D) Quantification of BrdU + nuclei. A one-way ANOVA was performed, F(2, 25) = 34.15, p < 0.0001. Tukey’s multiple comparisons test was performed for post-hoc analysis. (E-F”) Cryosections of the basal turn of the P0 and P30 cochlea were stained with Ki67 (green), Lectin (magenta) and DAPI. Scale bars: 100 µm for low magnification images; 50 µm in high magnification images. (G) Quantification of Ki67 in P0 and P30 SV using RT-qPCR. A two-tailed unpaired t-test was performed, t(4) = 70.16, p < 0.0001. *p = .0235, ****p < .0001. All graphs show mean with SEM.

    Journal: bioRxiv

    Article Title: Molecular differences between neonatal and adult stria vascularis from organotypic explants and transcriptomics

    doi: 10.1101/2024.04.24.590986

    Figure Lengend Snippet: (A-C) Representative images of organotypic stria vascularis explants at P0, P7 and P30 cultured with the proliferation marker, BrdU (red), over 72 h. (A’-C’) Merged images of BrdU + nuclei and DAPI stained nuclei (blue). Scale bars: 1 mm in A-B’; 200 µm in C-C’. (D) Quantification of BrdU + nuclei. A one-way ANOVA was performed, F(2, 25) = 34.15, p < 0.0001. Tukey’s multiple comparisons test was performed for post-hoc analysis. (E-F”) Cryosections of the basal turn of the P0 and P30 cochlea were stained with Ki67 (green), Lectin (magenta) and DAPI. Scale bars: 100 µm for low magnification images; 50 µm in high magnification images. (G) Quantification of Ki67 in P0 and P30 SV using RT-qPCR. A two-tailed unpaired t-test was performed, t(4) = 70.16, p < 0.0001. *p = .0235, ****p < .0001. All graphs show mean with SEM.

    Article Snippet: Griffonia (Bandeiraea) Simplicifolia Lectin I (GSL I, BSL I), Fluorescein (1:250; Vector Laboratories FL-1101-2), or Rhodamine (Vector Laboratories RL-1102-2) was used to stain blood vessels.

    Techniques: Cell Culture, Marker, Staining, Quantitative RT-PCR, Two Tailed Test

    A GSL-II lectin pull-down assay for integrin β1. Proteins in cell lysates from B4GALT1 knockdown PLC5 and HA22T cells and B4GALT1 knockout PLC5 cells were pulled down using GSL-II agarose beads and immunoblotted using an anti-integrin β1 (ITGB1). Three independent siRNAs for B4GALT1and two independent B4GALT1 knockout clones were used, as indicated. B GSL-II lectin pull-down assay for integrin α6. Proteins in the cell lysates from B4GALT1 knockdown PLC5 and HA22T cells and B4GALT1 knockout PLC5 cells were pulled down using GSL-II agarose beads and immunoblotted using an anti-integrin α6 (ITGA6). C B4GALT1 predominantly modified N-glycans on integrin β1. PLC5 cell lysates (0.5 mg) were treated with PNGase F and then pulled down (PD) using GSL-II lectin. The pull-down proteins were separated using 6% SDS-PAGE and analyzed via immunoblotting with anti-ITGB1. D B4GALT1 predominantly modified N-glycans on integrin α6. PLC5 cell lysates (0.5 mg) were treated with PNGase F and then pulled down (PD) using GSL-II lectin. The pulled-down proteins were separated using 6% SDS-PAGE and analyzed via immunoblotting using anti-ITGA6 (A) or anti-ITGA6 (B) antibody. Representative results from three independent experiments are shown. Data are presented as the mean ± SD. * P < 0.05; ** P < 0.01; *** P < 0.001, Student’s t -test.

    Journal: Oncogenesis

    Article Title: Decreased B4GALT1 promotes hepatocellular carcinoma cell invasiveness by regulating the laminin-integrin pathway

    doi: 10.1038/s41389-023-00494-y

    Figure Lengend Snippet: A GSL-II lectin pull-down assay for integrin β1. Proteins in cell lysates from B4GALT1 knockdown PLC5 and HA22T cells and B4GALT1 knockout PLC5 cells were pulled down using GSL-II agarose beads and immunoblotted using an anti-integrin β1 (ITGB1). Three independent siRNAs for B4GALT1and two independent B4GALT1 knockout clones were used, as indicated. B GSL-II lectin pull-down assay for integrin α6. Proteins in the cell lysates from B4GALT1 knockdown PLC5 and HA22T cells and B4GALT1 knockout PLC5 cells were pulled down using GSL-II agarose beads and immunoblotted using an anti-integrin α6 (ITGA6). C B4GALT1 predominantly modified N-glycans on integrin β1. PLC5 cell lysates (0.5 mg) were treated with PNGase F and then pulled down (PD) using GSL-II lectin. The pull-down proteins were separated using 6% SDS-PAGE and analyzed via immunoblotting with anti-ITGB1. D B4GALT1 predominantly modified N-glycans on integrin α6. PLC5 cell lysates (0.5 mg) were treated with PNGase F and then pulled down (PD) using GSL-II lectin. The pulled-down proteins were separated using 6% SDS-PAGE and analyzed via immunoblotting using anti-ITGA6 (A) or anti-ITGA6 (B) antibody. Representative results from three independent experiments are shown. Data are presented as the mean ± SD. * P < 0.05; ** P < 0.01; *** P < 0.001, Student’s t -test.

    Article Snippet: For the lectin pull-down assay, cell lysates (1 mg) were incubated with Griffonia Simplicifolia Lectin II (GSL-II) biotinylated (Vector Laboratories) at 4 °C for 16 h. The next day, the sample was incubated with streptavidin beads (Vector Laboratories) for 2 h at room temperature.

    Techniques: Pull Down Assay, Knockdown, Knock-Out, Clone Assay, Modification, SDS Page, Western Blot